The purpose of this post is to show how to create a customized Bid Summary and Analysis Dashboard using Claude’s Opus 5.5 AI model and data stored in a CSV file. This example will utilize pricing data from a fictional timber bid solicitation. Foresters can use a similar approach to create a customized bid results dashboard with an interactive and engaging interface. When replicating this project using real data, it’s good practice to scrub any personal or proprietary information from the data file before uploading it to Claude.
Tech Stack
The tech stack used for this example is standard HTML, CSS, and Javascript. The HTML file output can be opened within a Browser. Note this is not a “live” webpage, all the files remain local to your computer.
Prompt
The following was copied to a chat prompt window in Claude Desktop. The desktop version of Claude is required to provide local access to your files and directories.
<persona>
	You are a forest manager working on a timber sale bid.
    You have the bid results and now need a bid analysis
    and a dashboard to view the results.
</persona>

<context>
	Five loggers provided prices for the bid sale.
    The per ton prices are shown by product and logger
    in the data.csv file, and the expected tons for each
    product are listed in volume-estimates.csv.
</context>

<input-format>
	The data is contained in the following CSV files, data.csv,
    and volume-estimates.csv.
</input-format>

<task>
	Create an interactive dashboard that ranks logger bids
    in descending order given the highest prices provided.
    The analysis should calculate and report an overall estimate
    of value "Price x Quantity" using each logger's price
    and the quantity (tons) provided.  In addition, provide
    a summary section showing the spread of the prices and the
    mean price for each product.  If there is anything missing,
    please prompt me before creating the dashboard.
</task>

<response-format>
	HTML dashboard fully interactive with CSV and Javascript.
    The dashboard should be easy to read, using fonts and colors
    to draw the viewers attention.  Interactivity should include
    filters, charts, graphs, or any visual element that provides
    relevance to the analysis.
</response-format>
The prompt is structured as using XML format for clarity and organization. It is not necessary to use XML tags, the main point is that this structure is useful when prompting AI. Other suitable formats include Markdown or Plain-text. The prompt was copied directly to the Claude Desktop chat window and run using the Opus 5.5 model.
Display Results
The output is an HTML page that displays results of the bid analysis using estimated timber volume and submitted prices. The dashboard highlights the margin over the second bidder, the bid ranking, and the total value in dollars expected for each bid. Also, note that Claude provided controls for upload and export functionality in the dashboard header.
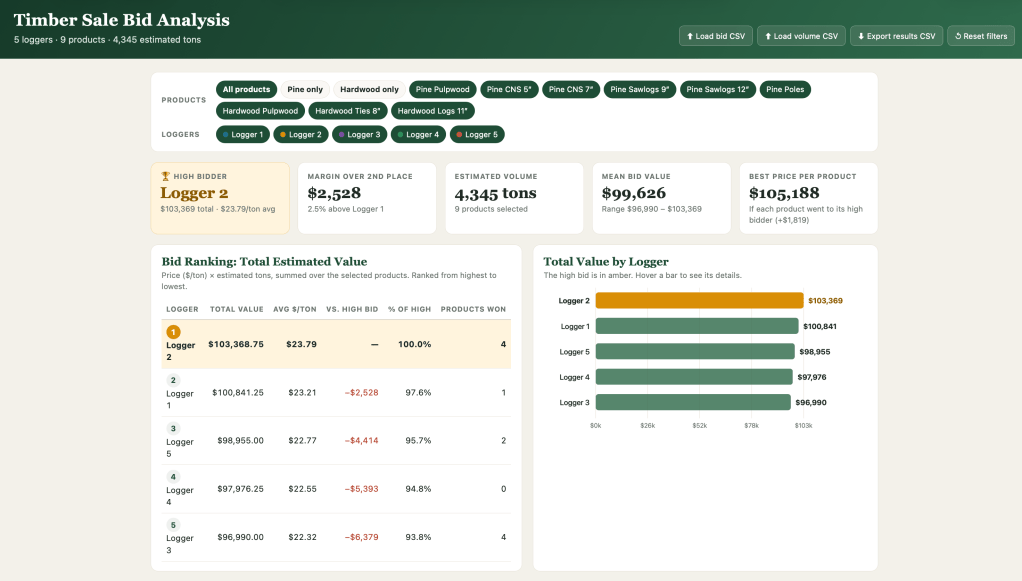
The interactive components display results for single products and product groups (e.g. Pine or Hardwood). It also displays a Product-Logger matrix with the prices submitted for each product, highlighting the high bid for each. A Price Summary shows the low, high, mean, and spread for each product. And finally, a bar chart shows the value contribution of each product to the total value for the bid.
It is important to note that all the products in the input files had an associated price and volume estimate. I would include a statement in the prompt describing how the model should address this if there were unmatched products, prices, or estimates.
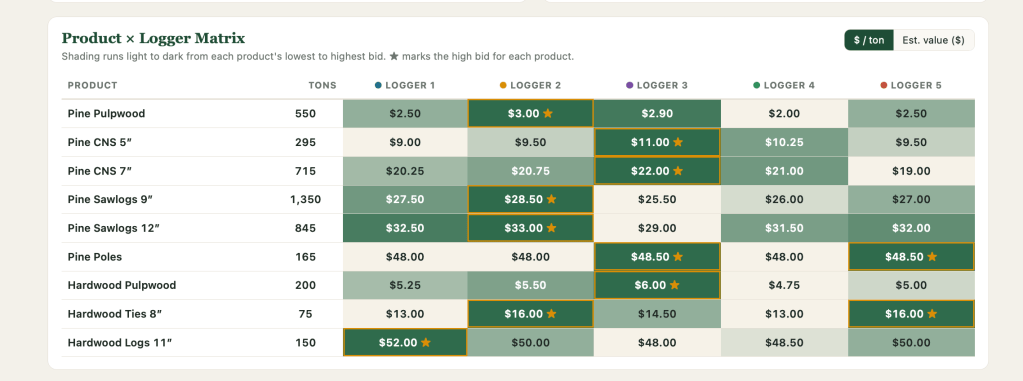
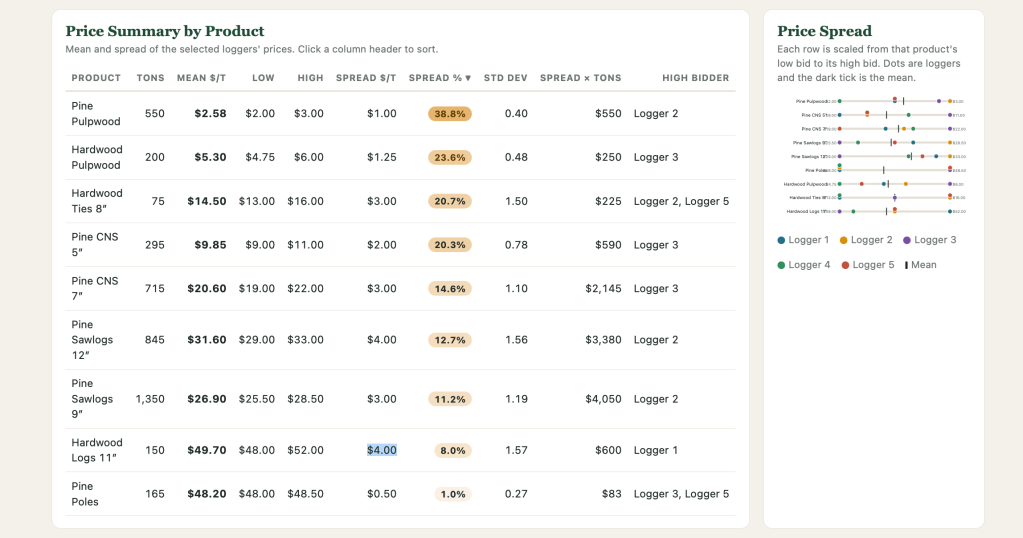
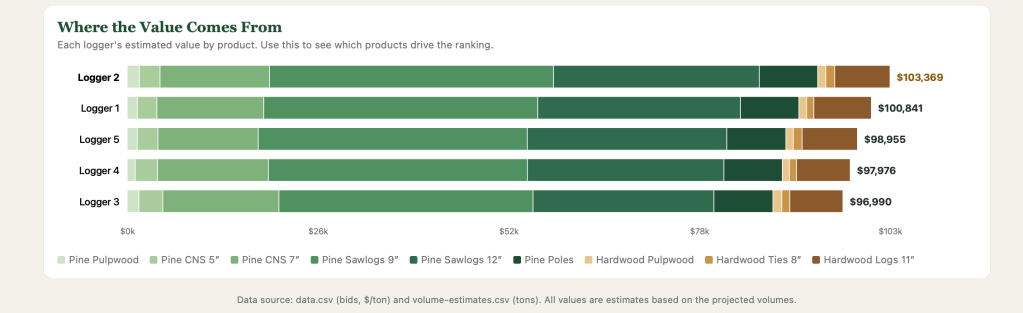
After many years of analyzing timber sale bids, I have accumulated a number of Spreadsheets for doing this type of bid analysis. However, those Spreadsheets lacked the visual appeal and interactivity of this example webpage. This project took very little time to complete, and can be easily replicated for similar projects.
This example shows how AI platforms like Claude excel at handling repetitive tasks and can produce interactive content for common business tasks.
Categories: artificial intelligence Data Analytics


Leave a Reply